

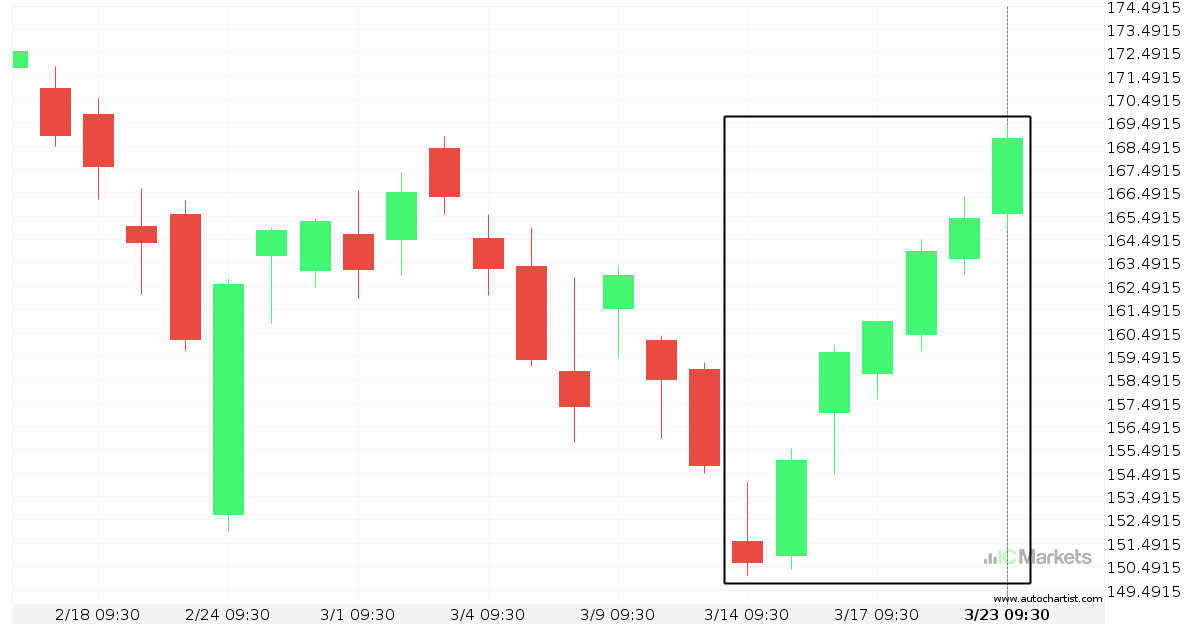
Apple Inc. experienced an exceptionally large movement
For those of you that don’t believe in trends, this may be an opportunity to take advantage of an exceptional 18,83% move on Apple Inc.. The movement has happened over the last 17 days. For those trend followers among you, you may think about riding this possible trend.
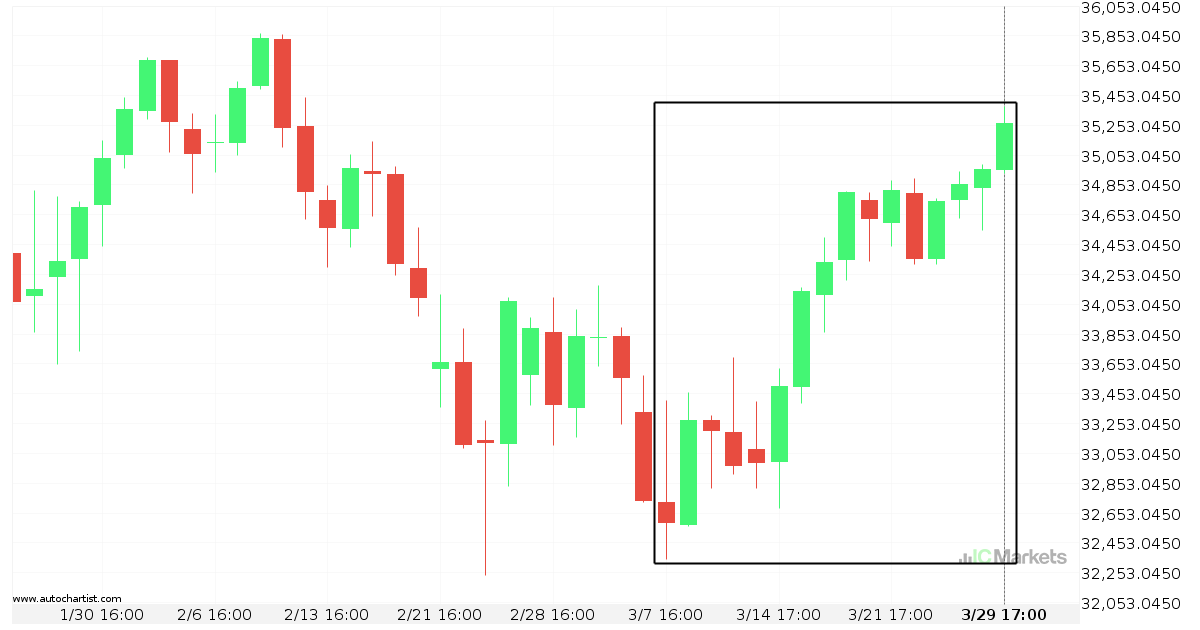
US Wall Street 30 Index is on its way up
US Wall Street 30 Index has experienced an exceptionally large movement higher by 8,29% from 32.722 to 35.281,4 in the last 23 days.
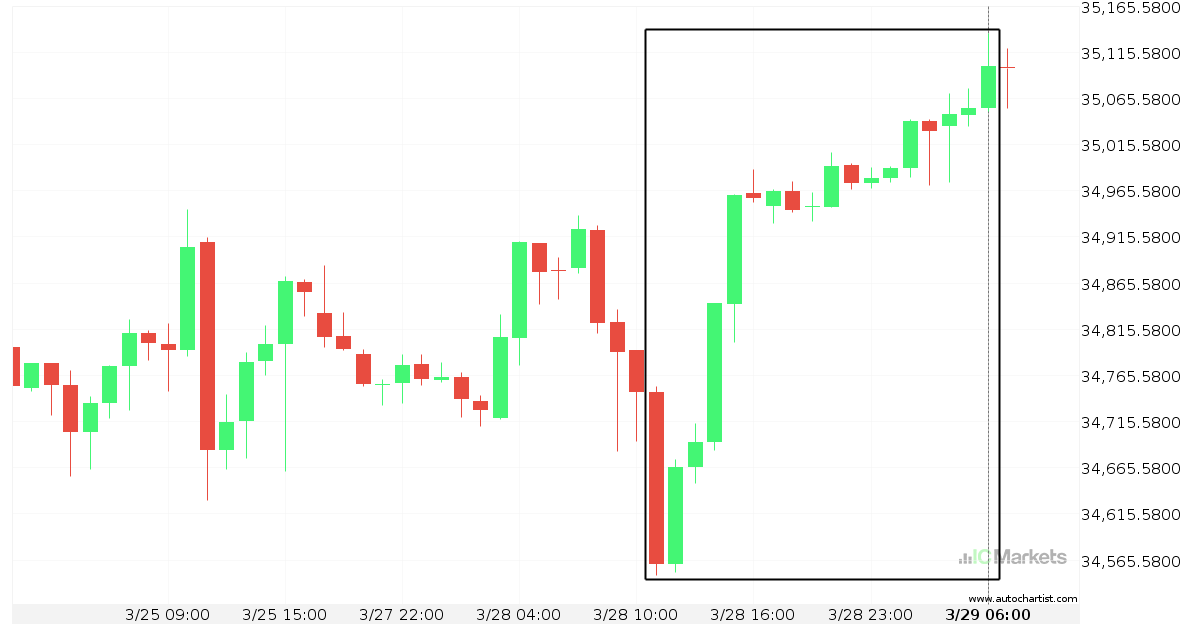
US Wall Street 30 Index is on its way up
US Wall Street 30 Index has experienced an exceptionally large movement higher by 1,56% from 34.747,5 to 35.099,6 in the last 19 hours.
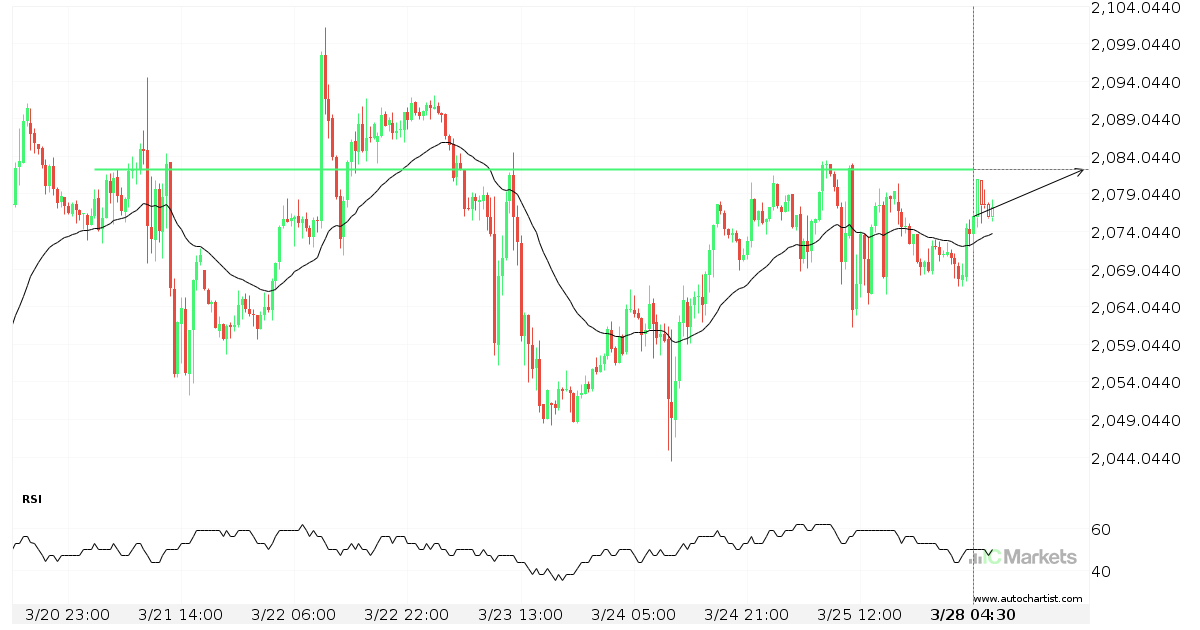
Should we expect a breakout or a rebound on US Small Cap 2000 Index?
The movement of US Small Cap 2000 Index towards 2082.2900 price line is yet another test of the line it reached numerous times in the past. We could expect this test to happen in the next 2 days, but it is uncertain whether it will result in a breakout through this line, or simply rebound […]
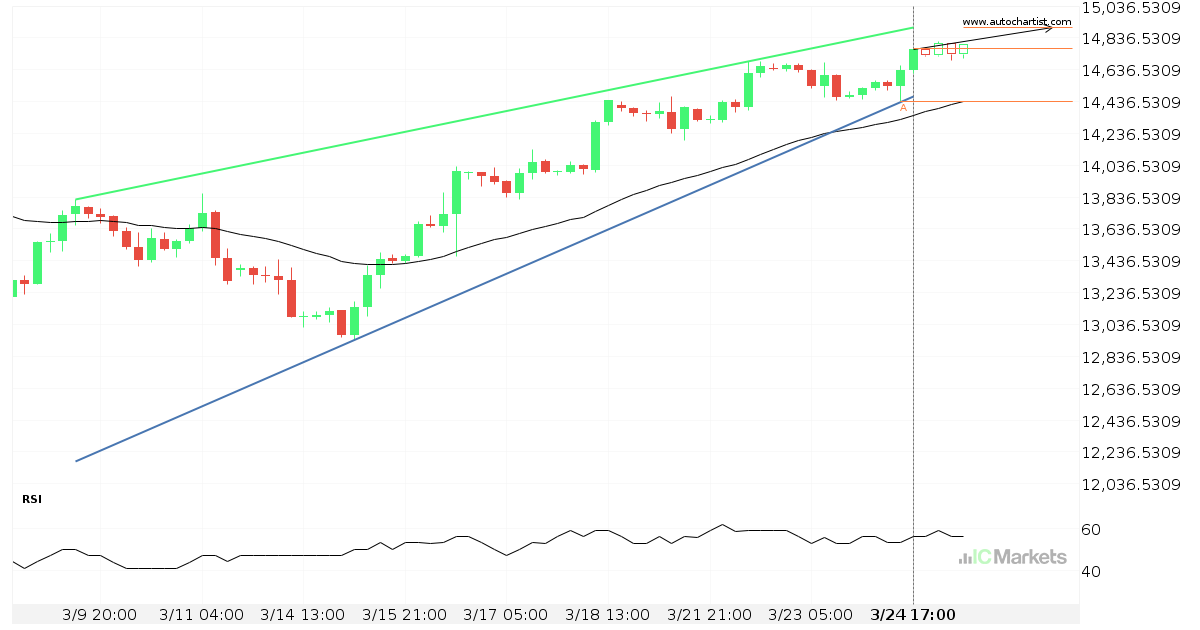
Possible breach of resistance level by US Tech 100 Index
US Tech 100 Index is moving towards a resistance line which it has tested numerous times in the past. We have seen it retrace from this line before, so at this stage it isn’t clear whether it will breach this line or rebound as it did before. If US Tech 100 Index continues in its […]
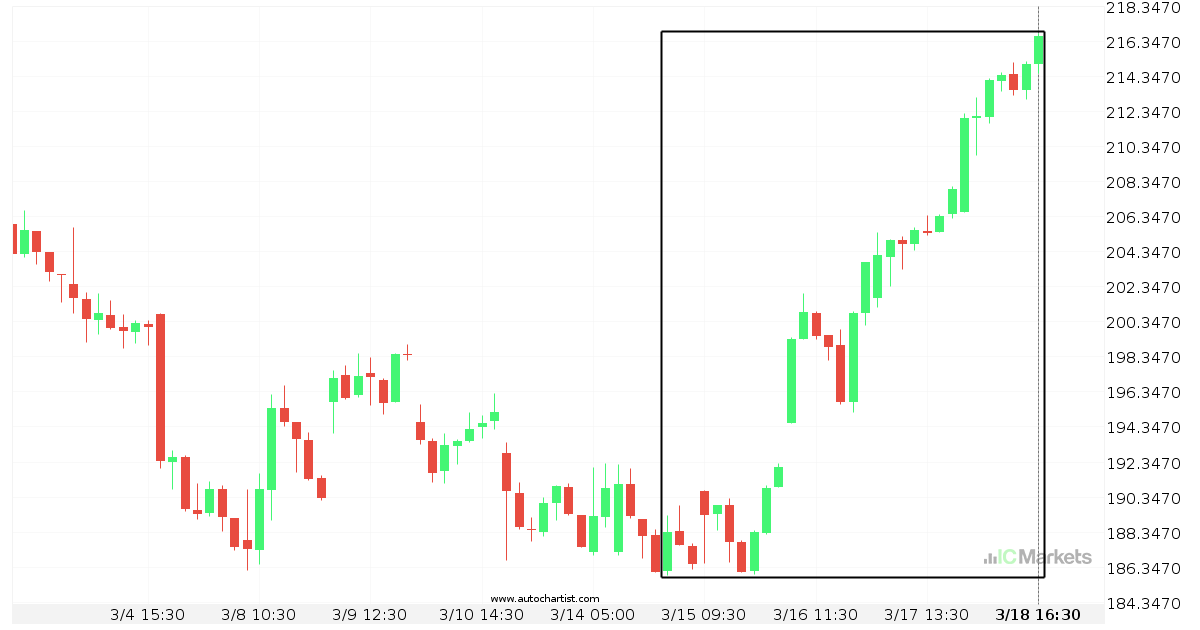
What’s going on with Apple Inc.?
Those of you that are trend followers are probably eagerly watching Apple Inc. to see if its latest 12,08% move continues. If not, the mean-reversion people out there will be delighted with this exceptionally large 10 days move.
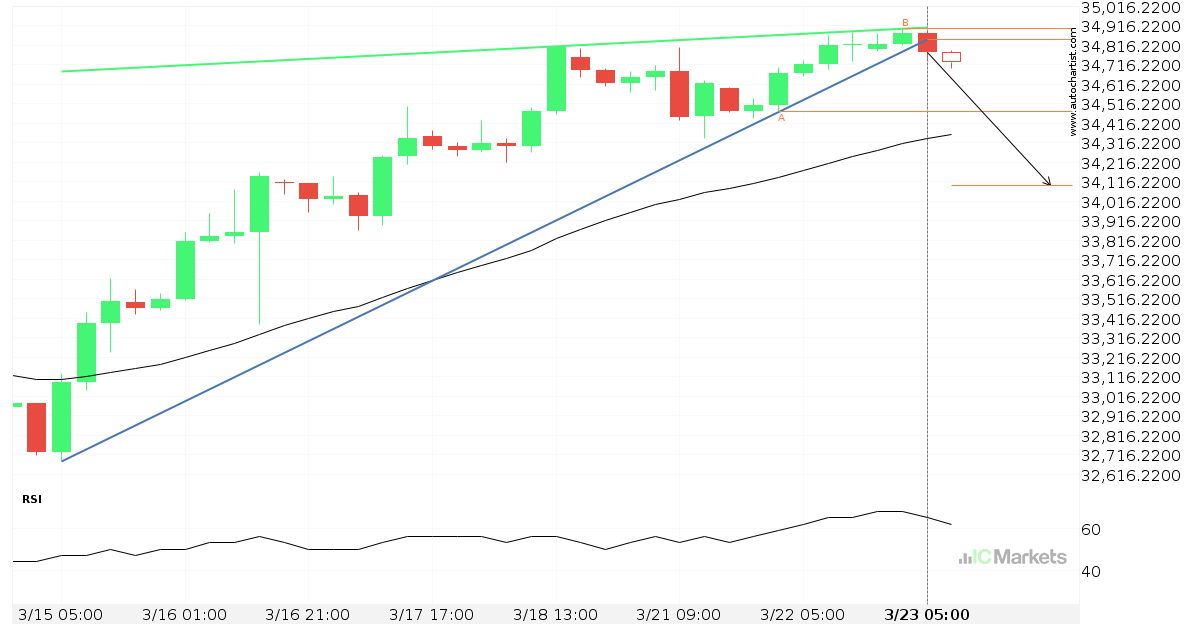
Support line breached by US Wall Street 30 Index
US Wall Street 30 Index has broken through the support line which it has tested twice in the past. We have seen it retrace from this line before, so one should wait for confirmation of the breakout before trading. If this new trend persists, a target level of around 34097.4644 may materialize within the next […]
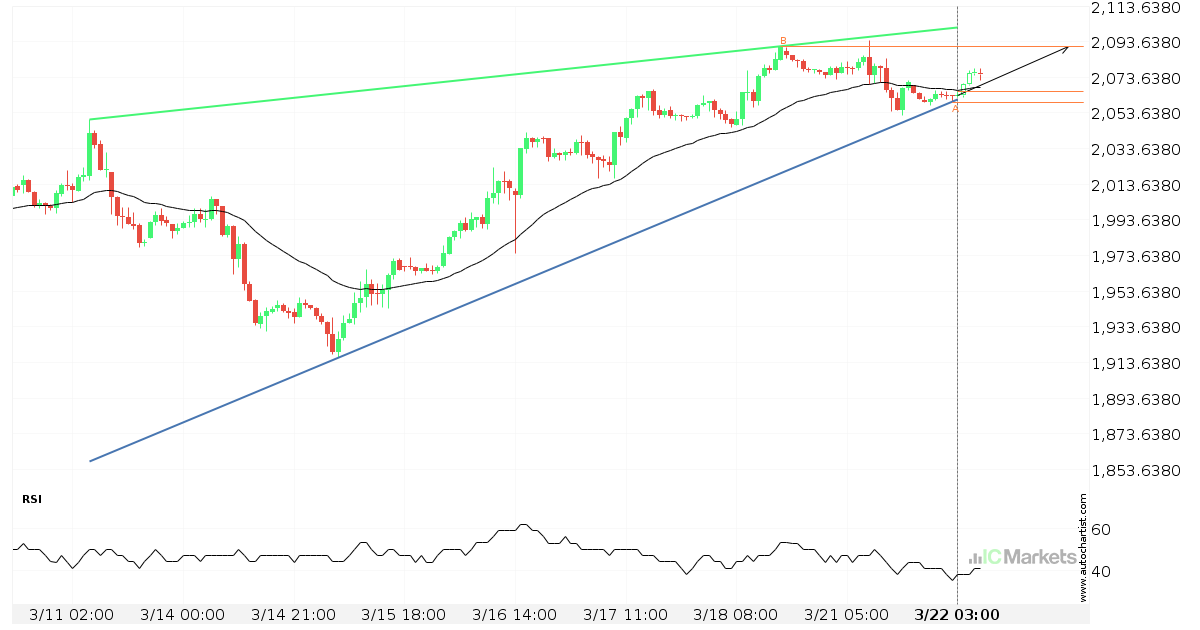
Will US Small Cap 2000 Index have enough momentum to break resistance?
US Small Cap 2000 Index is heading towards the resistance line of a Cunha ascendente and could reach this point within the next 2 days. It has tested this line numerous times in the past, and this time could be no different from the past, ending in a rebound instead of a breakout. If the […]
What’s going on with FACEBOOK?
Those of you that are trend followers are probably eagerly watching FACEBOOK to see if its latest 15% move continues. If not, the mean-reversion people out there will be delighted with this exceptionally large 5 days move.
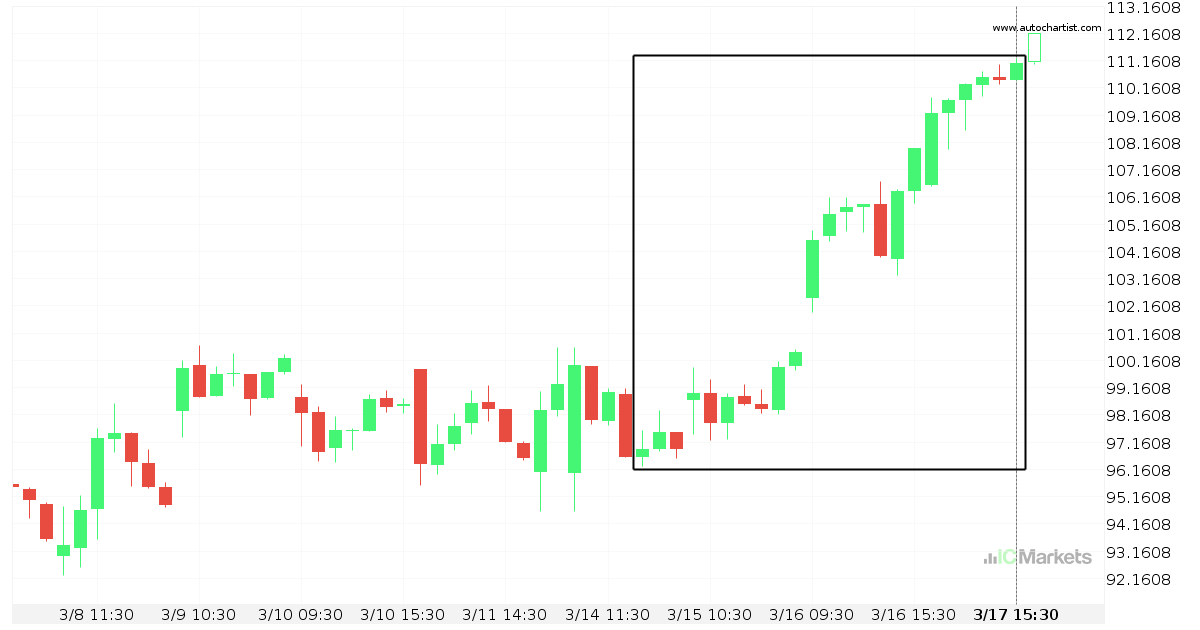
Paypal Holdings Corp is on its way up
Paypal Holdings Corp has experienced an exceptionally large movement higher by 14,6% from 96,6 to 111,04 in the last 4 days.